Detecting potential issues before they become real problems is very essential in minimizing business risk of data breach or any other security attacks. Especially in today’s business technology situation, where every day there are millions and billions of events that happened on the system. Thus, it is impossible for any human being to manually check and detect any anomaly that happens inside their system. That is why SIEM has become increasingly crucial. SIEM is a solution that enables the detection of incidents and offers observability over an organization’s security.
What is DSIEM?
To give business better visibility of their security system, Defenxor introduces DSIEM, a free open source-based security event correlation engine for ELK stack, allowing the platform to be used as a dedicated and full-featured SIEM system. DSIEM provides OSSIM-style correlation for normalized logs/events, perform lookup/query to threat intelligence and vulnerability information sources, and produces risk-adjusted alarms.
DSIEM is a security event correlation engine for ELK (Elastic, Logstash, Kibana) stack, allowing the platform to be used as a dedicated and full-featured SIEM system. DSIEM provides OSSIM-style correlation for normalized logs/events, perform lookup/query to threat intelligence and vulnerability information sources, and produces risk-adjusted alarms.
Features
There are plenty of DSIEM features that could be explored by developers, but the features of DSIEM features that distinguish this project to other SIEM:
Runs in standalone or clustered mode with NATS as messaging bus between frontend and backend nodes. Along with Elastic, this makes the entire SIEM platform horizontally scalable.
Enriches alarms with information from threat intelligence and vulnerability information sources. Built-in support for Moloch Wise and Nessus CSV exports. Other sources can be integrated easily through plugins.
A cloud-native, 12 factor app, that is loosely coupled and designed to be composable with other infrastructure platforms. It is even possible to use DSIEM as an OSSIM-style correlation engine for non-Elastic stack.
How it Works
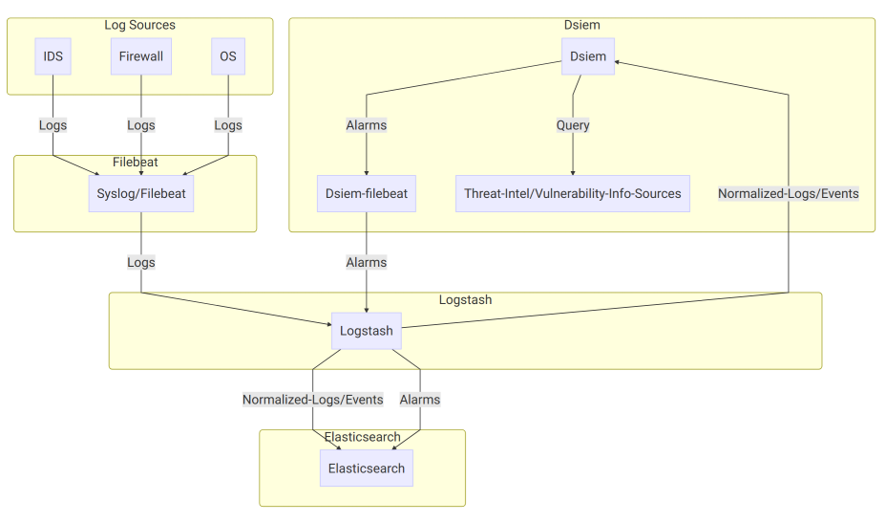
On the diagram above:
- Log sources send their logs to Syslog/Filebeat, which then sends them to Logstash with a unique identifying field. Logstash then parses the logs using different filters based on the log sources type, and sends the results to Elasticsearch, typically creating a single index pattern for each log type (e.g. suricata-* for logs received from Suricata IDS, ssh-* for SSH logs, etc.).
- Dsiem uses a special purpose logstash config file to clone incoming event from log sources, right after logstash has done parsing it. Through the same config file, the new cloned event is used (independently from the original event) to collect Dsiem required fields like Title, Source IP, Destination IP, and so on.
- The output of the above step is called Normalized Event because it represents logs from multiple different sources in a single format that has a set of common fields. Those events are then sent to Dsiem through Logstash HTTP output plugin, and to Elasticsearch under index name pattern siem_events-*.
- Dsiem correlates incoming normalized events based on the configured directive rules, perform threat intel and vulnerability lookups, and then generates an alarm if the rules conditions are met. The alarm is then written to a local log file, that is harvested by a local Filebeat configured to send its content to Logstash.
- At the logstash end, there’s another Dsiem special config file that reads those submitted alarms and push them to the final SIEM alarm index in Elasticsearch.
The result of the above processes is that now we can watch for new alarms and updates to an existing one just by monitoring a single Elasticsearch index.
Installation
The quickest and most reliable way to test Dsiem is to use the supplied Docker Compose files. They include Dsiem, all the required ELK stack, and an example log source (Suricata) pre-configured. Then after you get a feel on how everything fits together; you can start integrating Dsiem into your existing or custom ELK
Installing DSIEM
- Using Docker Compose
$ unzip dsiem-master.zip && cd dsiem-master
- Suricata needs to know which network interface to monitor traffic on. Tell it to use the network interface that has a working Internet connection on your system like this (for bash shell):
$ export PROMISC_INTERFACE=eth0
- Replace eth0 above with the actual interface name given by ifconfig or similar commands. For testing purpose, it’s not necessary to configure the interface to operate in promiscuous mode.
- Set the owner of filebeat config files to root:
$ cd deployments/docker && sudo chown root $(find conf/filebeat/ conf/filebeat-es/ -name “*.yml”)
* Here’s why the reason to use root user: https://www.elastic.co/guide/en/beats/libbeat/6.4/config-file-permissions.html
- Run ELK, Suricata, and Dsiem in standalone mode:
$ docker-compose pull
$ docker-compose up
- Everything should be up and ready for testing in a few minutes. Here’s things to note about the environment created by docker-compose:
- Dsiem web UI should be accessible from http://localhost:8080/ui, Elasticsearch from http://localhost:9200, and Kibana from http://localhost:5601.
- Suricata comes with Emerging Threats ICMP Info Ruleset enabled and EXTERNAL_NET: “any”, so you can easily trigger a test alarm just by continuously pinging a host in the same subnet. Dsiem comes with an example directive configuration that will intercept this “attack”.
- Recorded events will be stored in Elasticsearch index pattern siem_events-*, and alarms will be in siem_alarms. You can view their content from Kibana or Dsiem web UI.
- Importing Kibana Dashboard:
- Once Kibana is up at http://localhost:5601, you can import Dsiem dashboard and its dependencies using the following command:
$ ./scripts/kbndashboard-import.sh localhost $ ./deployments/kibana/dashboard-siem.json
- Do notice that like any Kibana dashboard, Dsiem dashboard also expect the underlying indices (in this case siem_alarms and siem_events-*) to have been created before it can be accessed without error. This means you will need to trigger the test alarm described above before attempting to use the dashboard.
Using Existing ELK
- First make sure you’re already familiar with how Dsiem architecture works by testing it using the Docker Compose method above. Also note that these steps are only tested against ELK version 6.4.2 and 6.8.0, though it should work with any 6.x version (or likely 7.x as well) with minor adjustment.
- Download Dsiem latest binary release and unzip it to a dedicated directory. For instance, to install the Linux version into /var/dsiem:
# [ “$EUID” -ne 0 ] && echo must be run as root! || (export DSIEM_DIR=/var/dsiem && mkdir -p $DSIEM_DIR && wget https://github.com/defenxor/dsiem/releases/latest/download/dsiem-server_linux_amd64.zip -O /tmp/dsiem.zip && unzip /tmp/dsiem.zip -d $DSIEM_DIR && rm -rf /tmp/dsiem.zip && cd $DSIEM_DIR
- Let the web UI knows how to reach Elasticsearch and Kibana by entering their URLs into /var/dsiem/web/dist/assets/config/esconfig.json:
$ cat esconfig.json {“elasticsearch”: “http://elasticsearch:9200”, “kibana”: “http://kibana:5601”}
- Adjust and deploy the example configuration files for Logstash from here. Consult Logstash documentation if you have problem on this.
- Install Filebeat on the same machine as dsiem, and configure it to use the provided example config
- Note that you should change /var/log/dsiem in that example to the logs directory inside dsiem install location (/var/dsiem/logs if using the above example).
- Also make sure you adjust the logstash address variable inside filebeat.yml file to point to your Logstash endpoint address.
* File config reference:
https://github.com/defenxor/dsiem/tree/master/deployments/docker/conf/filebeat ).
- Set Dsiem to auto-start by using something like this (for systemd-based Linux):
# [ “$EUID” -ne 0 ] && echo must be run as root! || ( cat <
- Dsiem web UI should be accessible from http://HostIPAddress:8080/ui
- Import Kibana dashboard from deployments/kibana/dashboard-siem.json. This step will also install all Kibana index-patterns (siem_alarms and siem_events) that will be linked to from Dsiem web UI.
$ ./scripts/kbndashboard-import.sh ${your-kibana-IP-or-hostname} ./deployments/kibana/dashboard-siem.json
Uninstall Dsiem
- For docker-compose installation, just run the following:
$ cd dsiem/deployments/docker && docker-compose down -v
or
$ cd dsiem/deployments/docker && docker-compose -f docker-compose-cluster.yml down -v
- For non-docker-compose procedure, you will have to undo all the changes made manually, such as:
- Remove the extra logstash plugins and configuration files.
- Uninstall Filebeat.
- Uninstall Dsiem by deleting its directory and systemd unit file, if any.
Documentation
Currently available docs are located here: https://github.com/defenxor/dsiem/blob/master/docs/